Related Articles


As consumers cope with lingering inflation, CBS News is tracking the change in prices of everyday household expenses — from food at the grocery store to utilities and even rent — across the country.
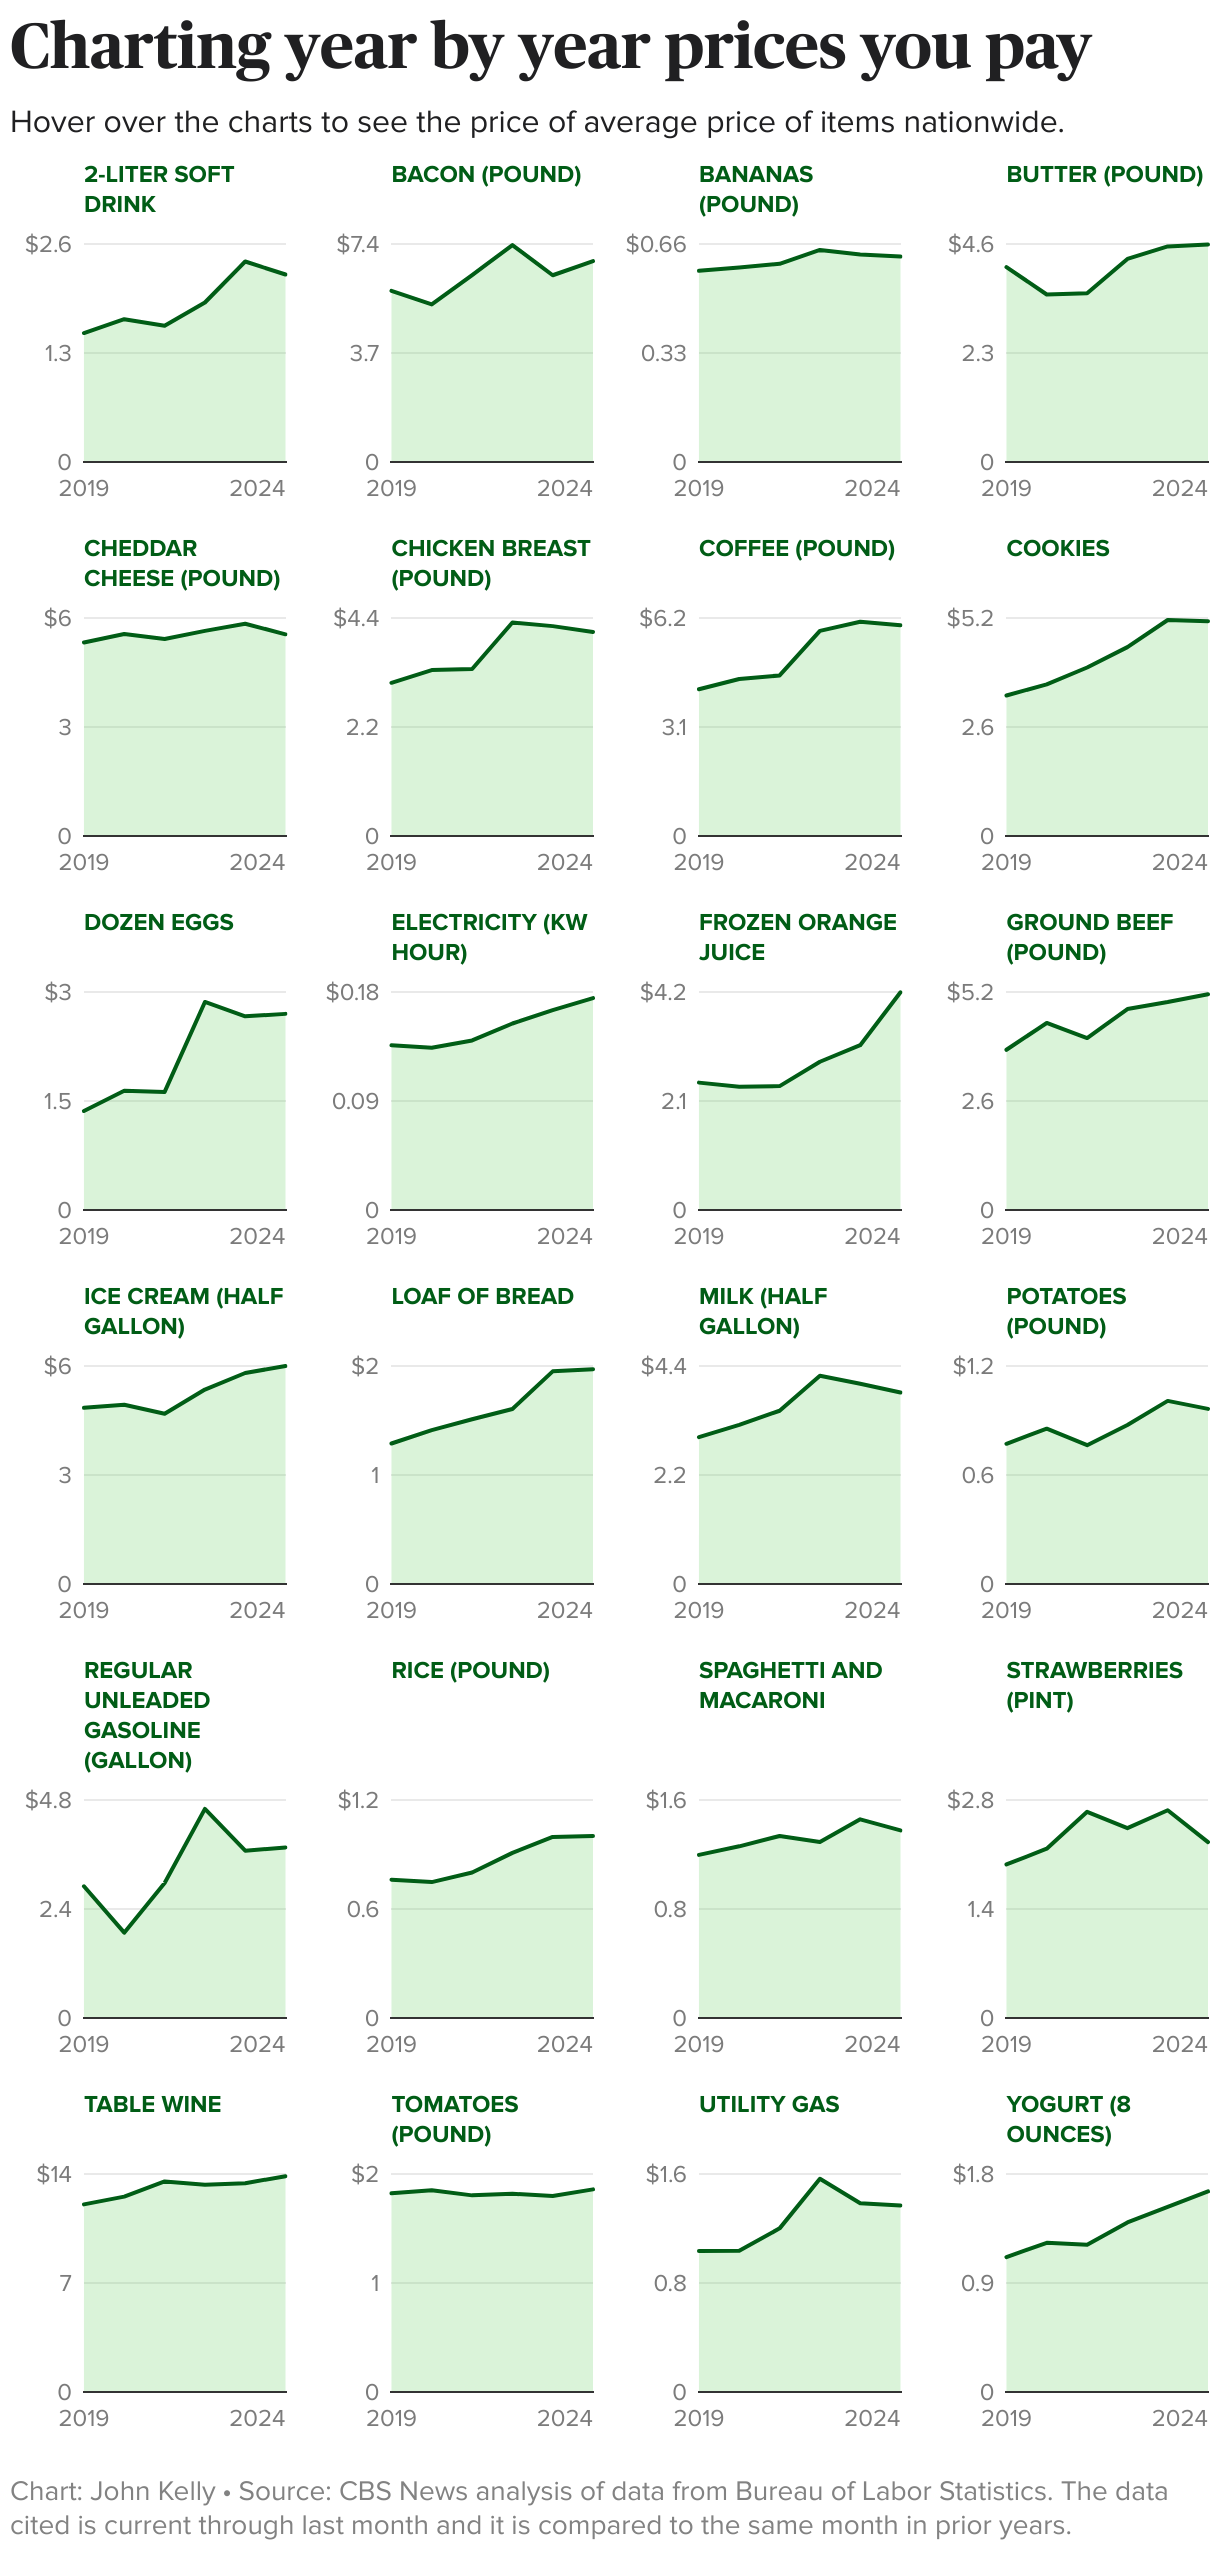
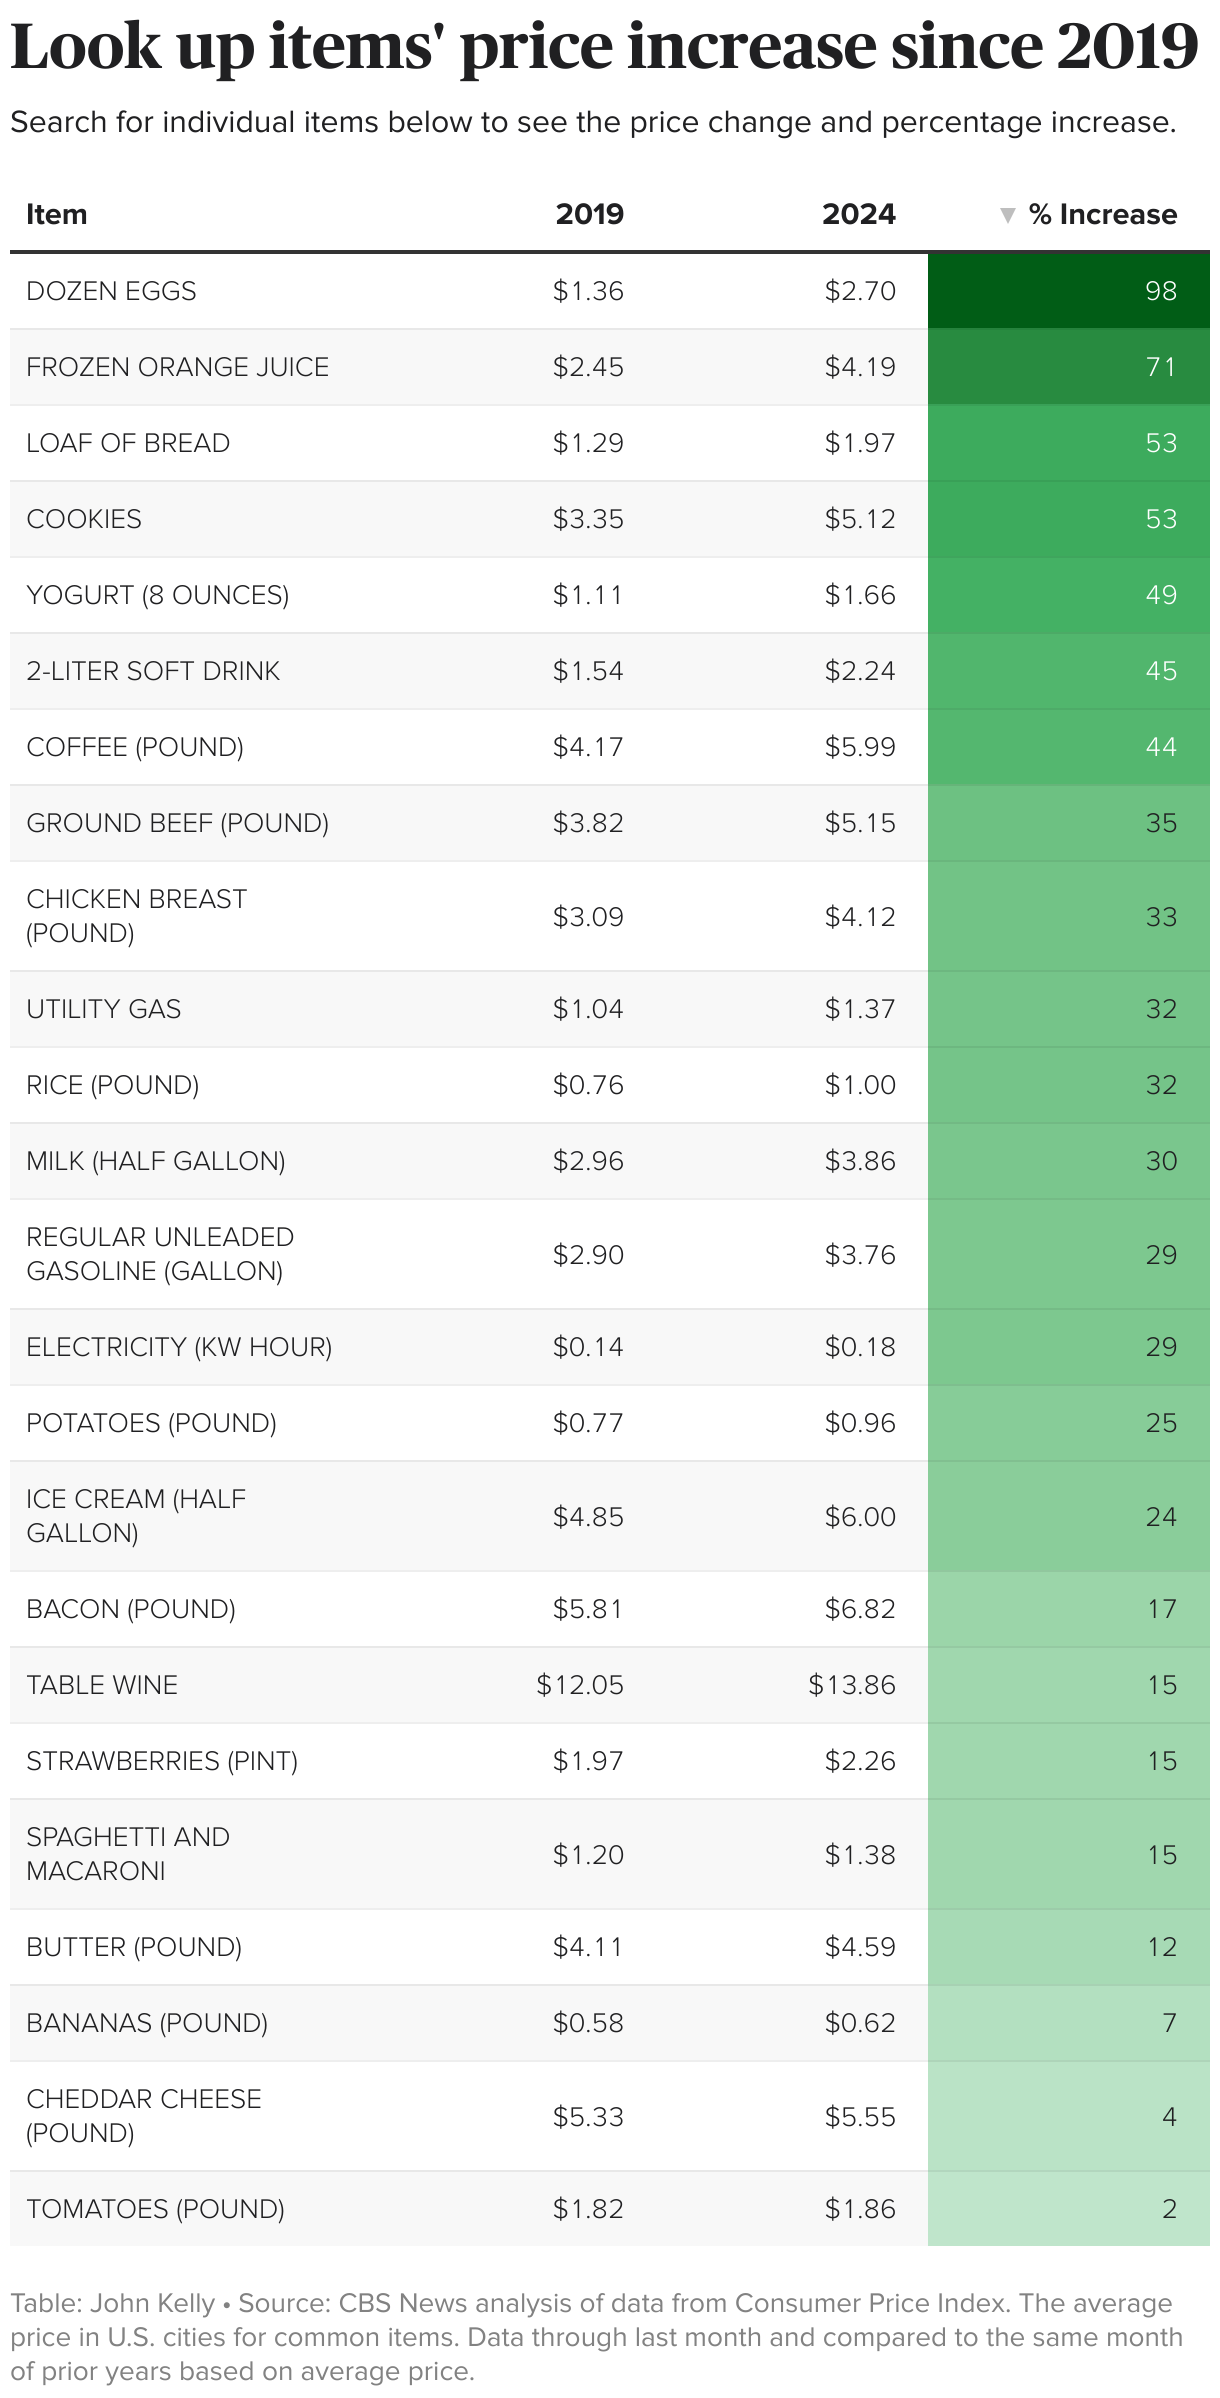
Drawing from a wide range of government and private data, the tracking charts below show how the cost of goods and services have changed since from before the pandemic to the most recent information available. That’s through the end of July for most items.
The price tracker is based on data released by the U.S. Bureau of Labor Statistics for food, household goods and services and Zillow for rent and home-purchase prices. Every chart notes, and links to, the source of the original data.
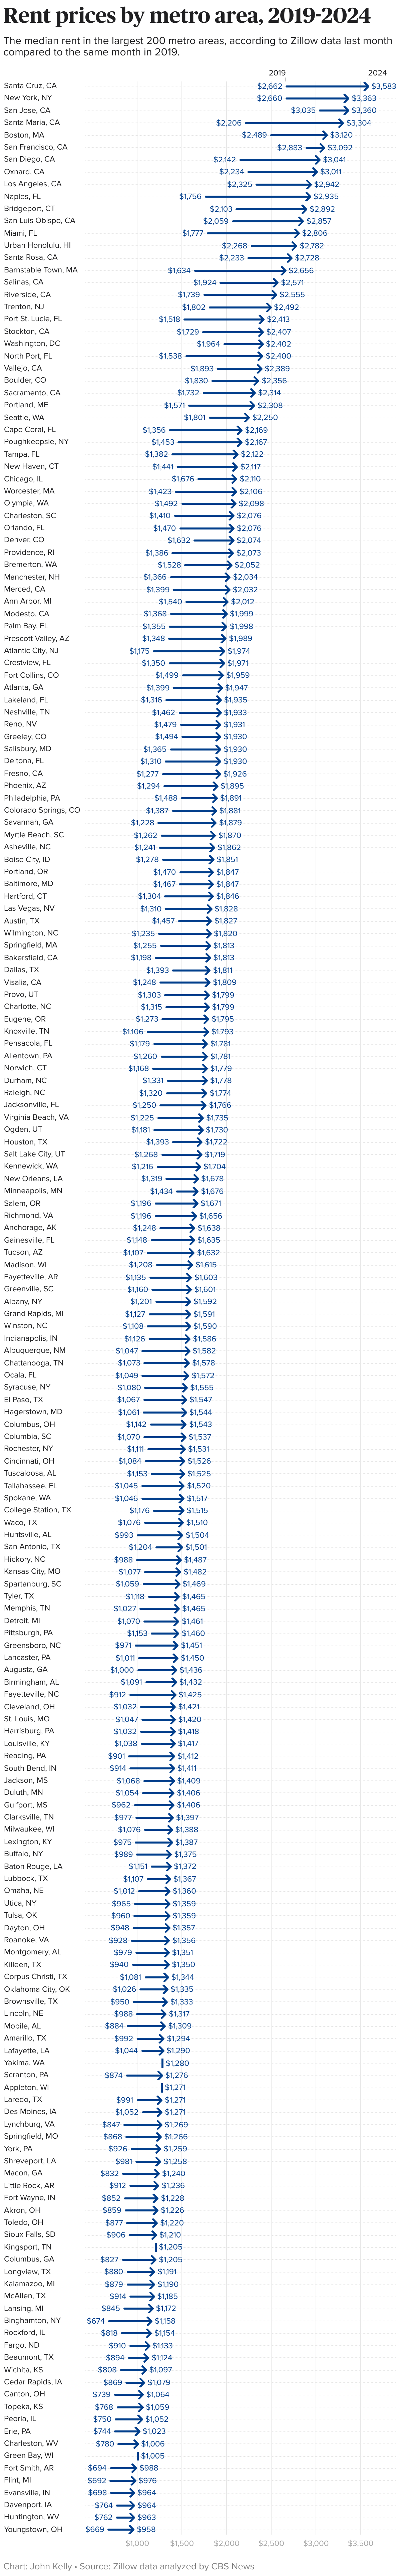
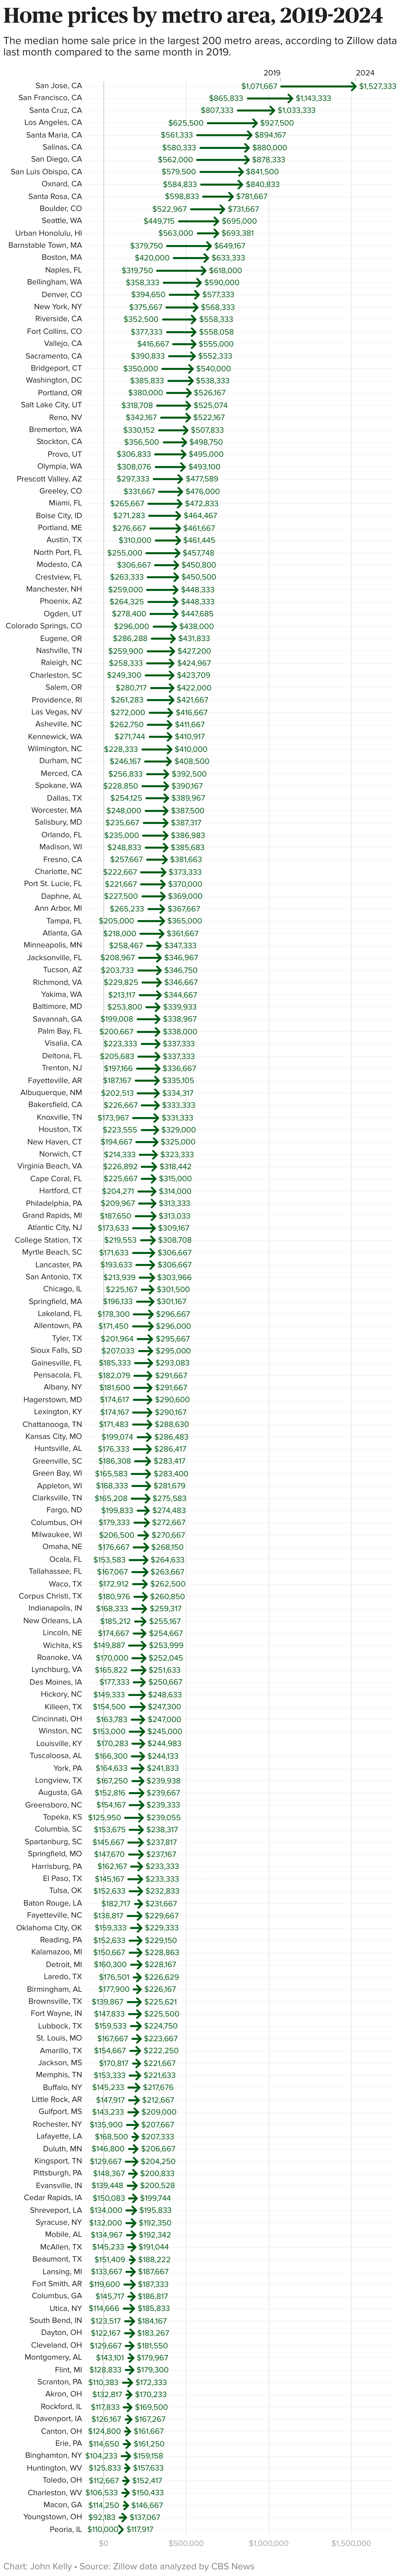
In the case of recurring household costs, rents and home sales, the 2024 data cited is current through last month and it is compared to the same month in prior years dating back to 2019.
The real estate data in the tracker is gathered by Zillow, which deeply studies home sales prices, rents and other housing costs using a combination of the listings on its own sites, public records and economic trends.